Embedded Expertise

Embedded Cartography: Architecture Beats Optimization

This second article continues a two-part story inspired by a real industrial project carried out for a railway OEM.

The first article described how a classical OpenStreetMap rendering architecture was successfully deployed onboard embedded rolling stock. This second part explores how rethinking the rendering pipeline itself led to significantly better performance and efficiency.

The first version of the platform already delivered surprisingly good results.

Using a classical OpenStreetMap rendering architecture built around PostgreSQL, PostGIS, Mapnik, Nginx, and a browser frontend, the system successfully provided country-scale railway cartography entirely offline onboard rolling stock.

The platform could visualize dense railway infrastructure over roughly 1000 × 1000 km down to metric precision while running entirely on an embedded Linux target from the NXP i.MX8 family. Local rendering, browser-based interaction, reverse proxy caching, and OpenStreetMap integration all operated reliably inside a moving embedded environment without any external infrastructure.

For many projects, that architecture would already have been more than sufficient.

After some time, however, the rendering pipeline started to feel heavier than necessary for the target. The platform still behaved fundamentally like a miniature internet tile server embedded inside rolling stock, and this observation progressively became difficult to ignore.

Looking Beyond Classical Optimization

The natural instinct when facing rendering latency is optimization. Rendering styles can be simplified, caches enlarged, pre-rendering extended, compression adjusted, and CPU usage tuned more aggressively.

All of these approaches are valid, and all of them help. But eventually, a different question started to emerge.

The platform already contained a spatial database storing vector geometries, a capable embedded GPU, and browser rendering engines already optimized for graphical rendering. Yet the system continuously transformed vector geographic data into raster PNG images through a CPU-centric pipeline originally designed for internet-scale infrastructures.

Once examined carefully, the rendering chain started to look surprisingly inefficient for an embedded target.

For every uncached tile, the system extracted vector geometries from the database, rasterized them in software through Mapnik, generated PNG images, stored them through the cache hierarchy, served them over HTTP, then decoded them again inside the browser before finally displaying them on screen.

None of these operations were unreasonable individually. Together, however, they represented a substantial amount of work whose only purpose was to continuously manufacture raster images from data that already existed in vector form.

At that point, optimization stopped looking like the central issue. The architecture itself became the real subject.

Moving Rendering Closer to the Client

The turning point came from changing where the rendering work was performed.

In the original architecture, the GIS database provided vector geometries, but the server-side rendering stack transformed them into PNG raster tiles before sending them to the client. Every display request, including requests coming from remote browsers, ultimately depended on the embedded platform itself performing software rasterization.

Rendering comparison
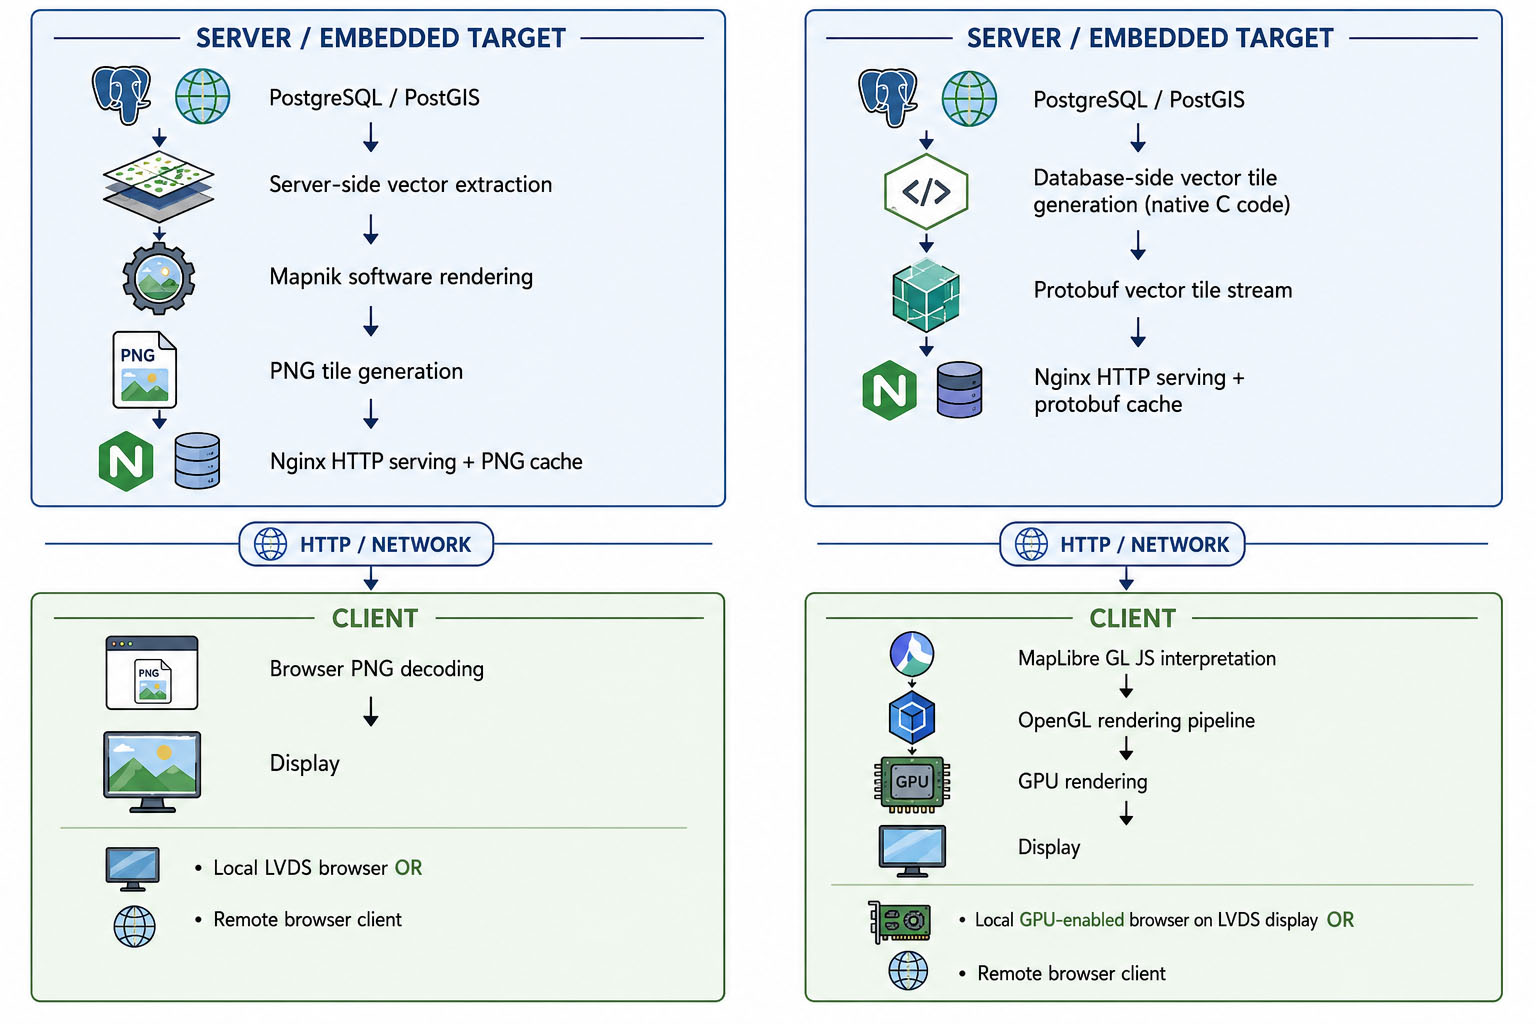
In the redesigned architecture, the database no longer fed a software rasterizer. Instead, it directly generated compact protobuf vector tiles from the GIS queries themselves.

This is an important distinction because the vector tile generation process is handled entirely inside the database layer and relies on highly optimized native C code rather than a custom application-side rendering loop.

The protobuf stream is sent over to the network (possibly on localhost), then consumed by a JavaScript rendering engine running on the client, typically MapLibre GL. The engine interprets the vector tile content, applies the rendering style, and builds the corresponding OpenGL rendering description of the visible map features.

On the local display, the final rendering stage is then handled by a GPU-enabled display client. This may be a standard browser in kiosk mode such as Chromium, or a lighter C++ wrapper feeding the GPU directly and pushing the resulting image toward the LVDS display pipeline.

The rendering chain therefore became significantly shorter and more direct.

The important point is that the project did not simply replace PNG files with another transport format. The architecture moved from server-side software rasterization toward database-side vector tile generation and GPU-assisted client rendering.

This changed the behavior of the entire platform.

Storage and Cache Behavior

One of the first visible effects concerned storage usage.

The original architecture relied heavily on raster tile caching. This worked remarkably well from a responsiveness perspective, but country-scale coverage combined with multiple zoom levels naturally generated very large PNG datasets.

The redesigned architecture fundamentally changed the nature of the cached data.

Instead of storing rendered raster images, the reverse proxy now cached compact protobuf vector payloads. On average, a protobuf vector tile was roughly ten times smaller than the equivalent raster PNG tile representing the same geographic area.

This remained a significant gain even in scenarios where keeping a server-side cache was still desirable. The cache hierarchy itself became far lighter, reducing storage pressure while preserving the responsiveness benefits of cached content.

Rendering performance also improved to the point where the reverse proxy cache itself progressively stopped being structurally necessary. The cache could still remain useful in some scenarios, but the platform no longer depended on exchanging large amounts of storage for acceptable responsiveness.

This represented a significant architectural change. The system no longer needed to compensate for rendering cost by accumulating raster artifacts on disk.

CPU Load and Rendering Distribution

The original pipeline continuously exercised the embedded CPU through software rasterization, PNG encoding, filesystem activity, cache management, and repeated image transfers.

The redesigned pipeline removed most of this work entirely.

Spatial extraction and vector tile generation remained inside the database layer, which already contained highly optimized code paths implemented in native C. Instead of generating raster imagery on the server side, the platform simply streamed compact vector payloads toward the frontend.

Rendering also became naturally distributed across the clients.

For the local display, rendering was performed by the GPU-enabled browser running directly on the embedded platform itself. Remote users, however, no longer depended on the embedded target generating raster tiles centrally. Their own browsers performed the rendering locally using their own resources, GPU-accelerated or not.

This changed the scaling behavior of the system quite significantly.

In the original architecture, every additional display ultimately increased rendering activity onboard the embedded platform. In the redesigned architecture, the embedded target mainly became a vector tile provider and spatial query engine, while the rendering load moved toward the clients themselves.

CPU activity on the embedded platform dropped sharply because the system no longer continuously rendered and compressed images in software.

This also had direct implications for power consumption and thermal behavior.

Embedded GPUs Are Different
In desktop environments, GPUs are often associated with high power usage. In embedded systems, however, specialized graphics hardware are considerably more efficient than continuously exercising general-purpose CPUs for rendering workloads.

Reducing software rendering also reduced memory traffic, filesystem activity, cache pressure, and overall thermal load. The gains propagated across the platform rather than remaining isolated to rendering speed alone.

Removing Unnecessary Transformations

What made this project particularly interesting is that the largest gains did not come from optimizing code.

They came from re-architecting by removing unnecessary transformations between data and display.

The original architecture continuously converted vector data into raster artifacts because this matched the assumptions of large-scale internet tile infrastructures. But onboard rolling stock, operating entirely offline on constrained embedded hardware, those assumptions no longer necessarily matched the actual nature of the system.

Once the architecture aligned more directly with vector geographic data, GPU rasterization, browser rendering engines, and embedded constraints, the platform became simultaneously faster, lighter, simpler, and more responsive.

This is a recurring pattern in embedded systems.

Performance problems are often approached as local optimization problems involving faster CPUs, larger caches, more threads, or lower-level tuning. Sometimes this is absolutely the correct approach.

But sometimes the largest gains come from stepping back and questioning whether the system should be doing certain categories of work at all.

Architecture Matters

Dedicated embedded navigation systems have existed for decades and already solved many of these problems through highly optimized proprietary rendering engines.

What made this project interesting was the decision to start from a standard OpenStreetMap web rendering architecture, then progressively reshape it around the realities of embedded hardware.

The first architecture was already functional and technically credible.

The second one simply aligned better with the actual nature of the platform and improved all the KPIs.

And in embedded systems, that distinction matters enormously. A good architecture does not merely run faster. It removes entire categories of complexity from the system.

Some parts of this project have been voluntarily simplified in this article, but the overall architectural direction and engineering challenges are real.

Developers or companies interested in similar embedded cartography systems, OpenStreetMap integration, vector rendering pipelines, or onboard GIS architectures are welcome to contact us.

We may also share selected implementation examples and architectural elements with engineers working on similar embedded rendering systems.

Enjoyed this article?
Embedded Notes is an occasional, curated selection of similar content, delivered to you by email. No strings attached, no marketing noise.