Embedded Cartography: Rising to the Challenge
This first article is inspired by a real industrial project carried out for a railway OEM. It describes the successful deployment of an OpenStreetMap rendering architecture on an embedded platform, with surprisingly good results given the modest hardware resources and the density of railway infrastructure data involved.
A second article will explore how the original architecture was later redesigned to dramatically improve performance and efficiency.
Project Summary
The objective was to deploy a fully autonomous cartography system onboard rolling stock, capable of visualizing railway infrastructure over an area spanning roughly 1000 × 1000 km. The application had to display high-speed lines, conventional railways, tramways, historical tracks, level crossings, and various infrastructure-related elements while allowing navigation from country-scale visualization down to metric-level inspection.
The system would render maps on both a local LVDS touchscreen and remote browser clients connected through the onboard network.
OpenStreetMap rapidly emerged as the primary map source for the project. Its coverage, rich railway-related data, mature tooling ecosystem, and open data model made it an excellent fit for large-scale infrastructure visualization.
At first glance, the problem looked relatively classical. The OpenStreetMap ecosystem already provides mature tools capable of handling large-scale geographic datasets, and the standard rendering architecture is both well documented and widely deployed.
But there was an important twist.
Everything had to run locally on the embedded target.
No internet connection.
No cloud backend.
No external tile server.
The hardware itself belonged to the NXP i.MX8 family, a class of embedded application processors widely used in industrial systems. The platform provided a capable Linux environment and embedded GPU acceleration, but still within the usual constraints of embedded hardware: limited storage, constrained thermal budgets (no fans or moving parts allowed), and compute resources shared with other functionalities.
In practice, embedding such a system inside rolling stock progressively revealed an interesting tension between architectures inherited from the web world and the realities of embedded hardware.
Building on the Standard OpenStreetMap Architecture
The initial implementation deliberately followed the traditional OpenStreetMap rendering model. This was not only the most natural starting point, but also a very reasonable engineering decision.
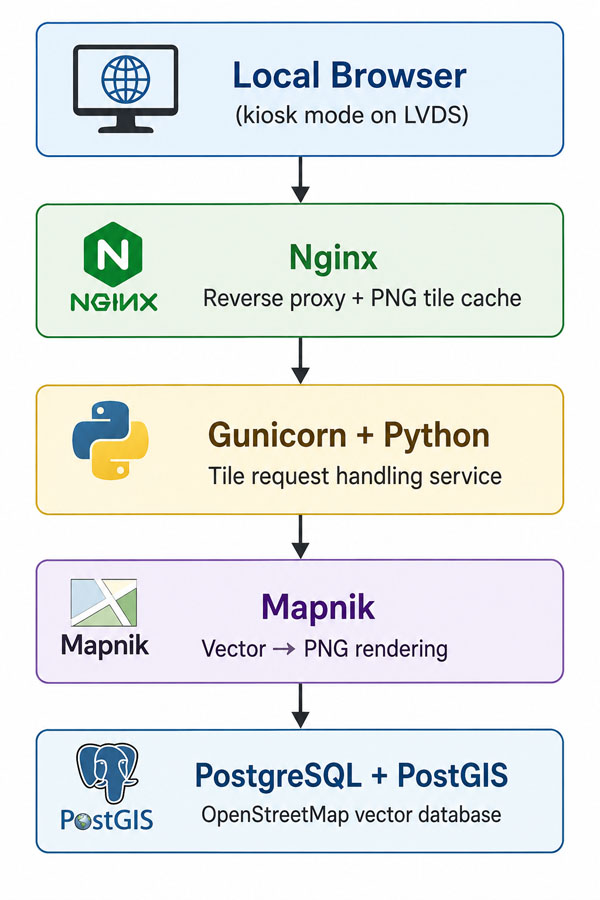
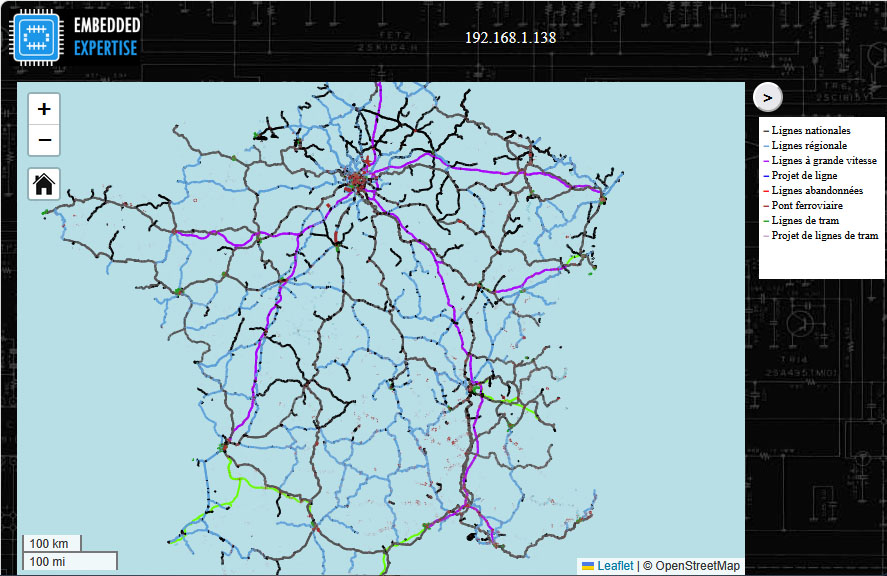
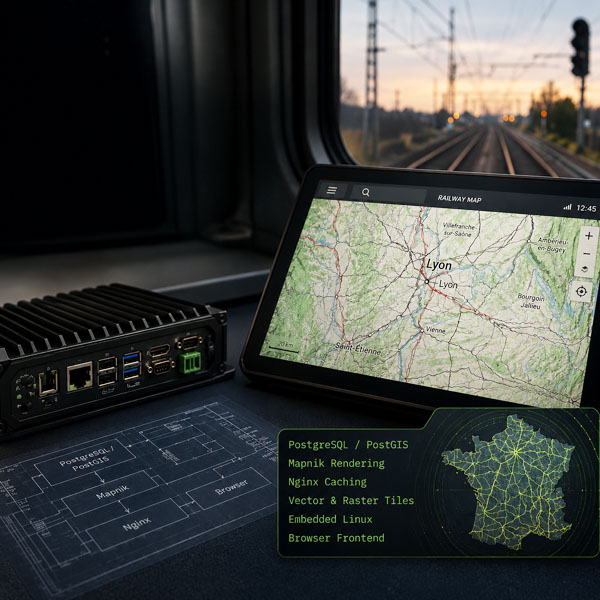
At the core of the platform sat a geographic database built around PostgreSQL and its spatial extension PostGIS. Railway infrastructure data extracted from OpenStreetMap remained stored as vector geometries inside the database, preserving both semantic information and scalability across zoom levels.
Rendering relied on Mapnik, one of the historical rendering engines of the OpenStreetMap ecosystem. A lightweight Python service executed through Gunicorn handled incoming tile requests, queried the database, invoked Mapnik, generated PNG raster tiles, and returned them over HTTP.
The resulting architecture remained surprisingly compact considering the scale of the problem.
Most of the heavy lifting was delegated to mature existing components rather than custom code.
The user interface itself intentionally remained very simple. A standard browser running locally in kiosk mode handled map navigation on the LVDS display, while remote users accessed the exact same interface through the onboard network.
This brought an important practical benefit: the entire visualization stack could rely almost entirely on standard web technologies.
Why the Tile Model Works So Well
One of the most elegant aspects of the traditional OpenStreetMap architecture lies in its tile-based rendering model.
Instead of rendering the entire map continuously, the world is divided into small raster images corresponding to fixed geographic areas and zoom levels. As the user pans or zooms, the browser simply requests the missing tiles on the move.
This approach transforms rendering into a highly cacheable problem.
Once generated, a tile becomes a reusable static asset. The rendering cost is paid once, then amortized through repeated reuse.
This is where Nginx became extremely valuable.
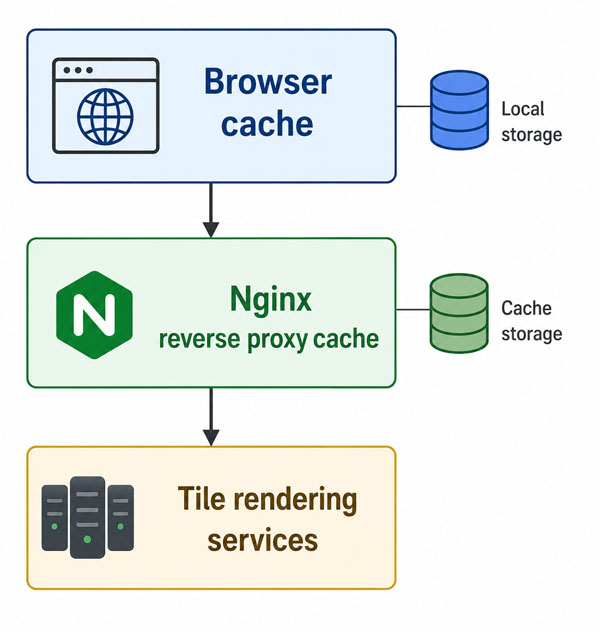
Acting as a reverse proxy with aggressive disk-backed caching, Nginx stored rendered PNG tiles locally and served them directly on subsequent requests without invoking the rendering engine again.
From an engineering perspective, this architecture is remarkably clever. It exchanges expensive rendering operations for comparatively cheap storage operations.
And in practice, it worked very well.
Once tiles had been generated and cached, redisplay became almost instantaneous. Areas already visited once felt highly responsive to all clients, even on embedded hardware.
A Surprisingly Small Application Layer
Another interesting aspect of the project was the relatively small amount of application-specific code involved in the final system.
Most of the platform relied on existing infrastructure components. PostgreSQL/PostGIS handled spatial storage and indexing, Mapnik handled rendering, Nginx handled caching and HTTP serving, while the browser engine itself handled display and interaction.
This did not mean the project was trivial. Quite the opposite.
Although the amount of custom code remained limited, significant engineering effort went into configuring, integrating, tuning, and adapting these components to an embedded environment. Rendering styles, spatial queries, tile generation behavior, cache policies, storage layout, browser interaction, and overall system responsiveness all required careful work.
But importantly, the project did not attempt to reinvent an entire GIS rendering stack from scratch.
Instead, it leveraged mature components already optimized and battle-tested by the broader OSM ecosystem, then adapted them carefully to the realities of embedded hardware.
When Embedded Reality Starts to Push Back
The system worked. Quite well, actually.
Navigation was already reasonably fluid thanks to the cache hierarchy. As users moved progressively across the map, tiles were often generated before becoming fully visible on screen. Once cached server-side by Nginx, redisplay became extremely fast.
But embedded systems have a way of exposing assumptions that remain mostly invisible on servers.
The Storage Side of the Equation
The first issue was storage.
The more aggressively the system cached tiles to improve responsiveness, the more storage it consumed. Large geographic coverage combined with multiple zoom levels naturally generated very large raster datasets.
In a datacenter environment, adding storage is often trivial.
Inside embedded rolling stock, it is not.
Flash capacity, write endurance, thermal behavior, filesystem activity, and long-term maintainability suddenly become part of the architectural equation.
The Latency Was Not Dramatic. Just Noticeable.
The second issue was responsiveness itself.
The platform was never unusable, but uncached rendering latency remained perceptible. Depending on the overall activity of the embedded CPU, generating a new tile could occasionally approach delays on the order of one second.
Most of the time this remained acceptable because map navigation is relatively continuous and predictable. Tiles usually appeared progressively at the border of the visible area as the user moved through the map.
Still, the delay was just noticeable enough to occasionally break the feeling of fluidity.
That detail turned out to matter more than expected.
Because under the hood, the system was still doing a surprising amount of work for every uncached tile.
Data had to be extracted from the spatial database, rendered in software through Mapnik, converted into PNG images, stored through the cache hierarchy, served over HTTP, then decoded again by the browser.
The embedded platform was effectively operating as a miniature web tile server onboard rolling stock.
The Question That Changed the Architecture
At this point, a deeper question started to emerge.
The system already contained:
- a powerful spatial database storing vector geometries
- a capable embedded GPU specifically designed for rasterization
- modern browser rendering engines
So why were we continuously transforming vector geographic data into stored raster PNG images through a CPU-centric pipeline originally designed for internet-scale infrastructures?
That question eventually led to a radically different architecture.
The next article explores how replacing PNG tile generation with direct vector streaming and GPU-assisted rendering transformed not only rendering speed, but also storage usage, CPU load, cache behavior, and overall system efficiency.
Some parts of this project have been voluntarily simplified in this article, but the overall architecture and engineering challenges are real.
Developers or companies interested in similar embedded cartography systems, OpenStreetMap integration, or onboard GIS architectures are welcome to contact Embedded Expertise.
Enjoyed this article?
Embedded Notes is an occasional, curated selection of similar content, delivered to you by email. No strings attached, no marketing noise.

